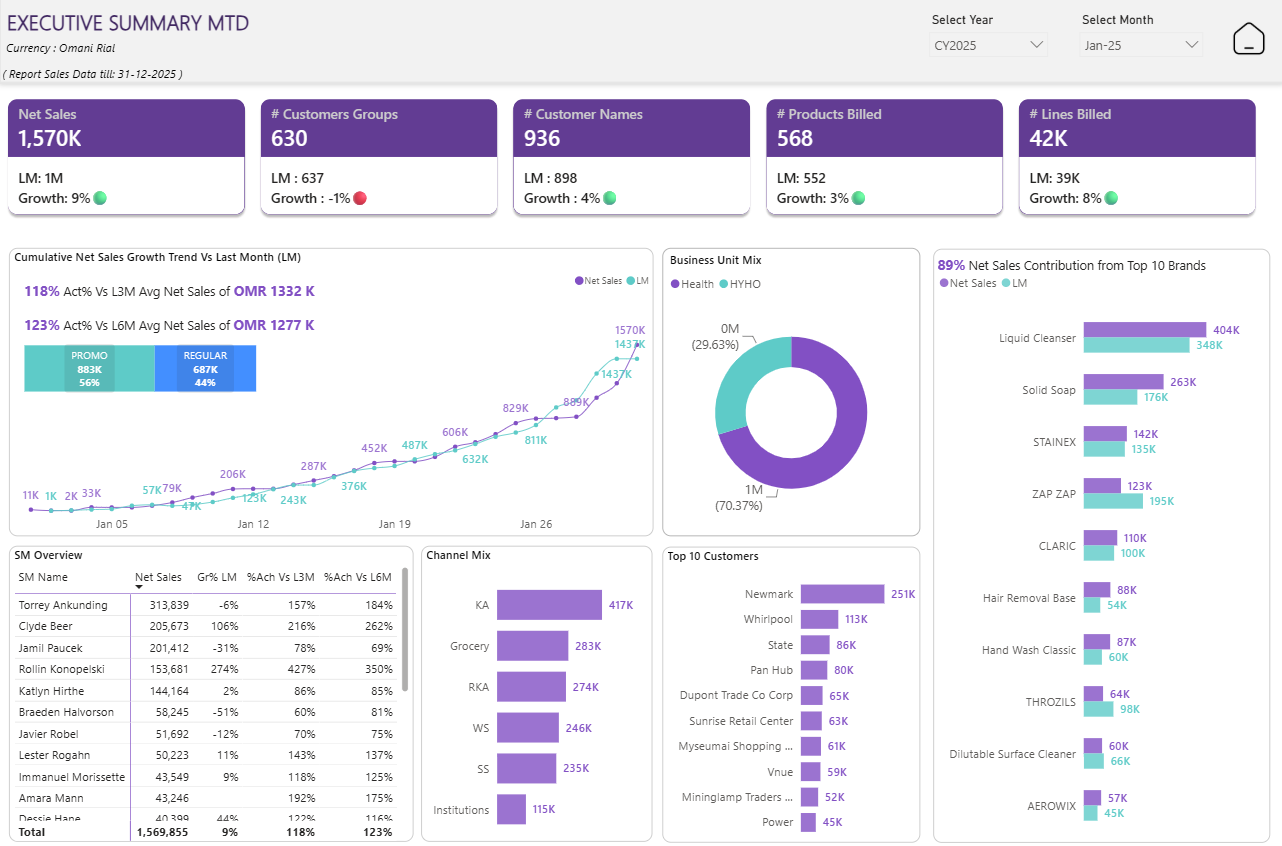
We Solve Complex Data Reporting Challenges

We build models that gather data from multiple silos (systems) into a single cohesive dashboard.

Let’s Start your project today!

A multinational home appliances company faced a huge challenge in consolidating recruitment data from multiple sources. We developed a Power BI dashboard to automate data collection, identify key metrics, and provide a clear overview of recruiter performance. 

PROBLEM

HR leaders were flying blind on recruitment performance while drowning in spreadsheets. 

SOLUTION

A Recruitment Analytics Power BI dashboard that unifies data and surfaces the most important hiring KPIs.

A prominent Indian bank faced challenges in tracking and analyzing its L&D initiatives from multiple offline and online training programs. We developed a comprehensive Power BI dashboard to streamline data management, uncover hidden insights and provide a centralized view to track organization wide L&D analytics.

PROBLEM

The L&D team had tons of learning data sitting inside the LMS, but no way to understand whether training was actually effective.

SOLUTION

A Learning Performance Dashboard in Power BI to centralize, automate and visualize training metrics across courses, functions and user groups.

A mid-sized trading company struggling with manual invoice and payment reconciliation was provided with a streamlined solution. By integrating disparate data sources and automating payment allocation, we created a comprehensive dashboard that offered real-time insights into billing, receivables, and invoice settlement.

PROBLEM

Finance teams were spending weeks manually reconciling billing and receivables, with no timely view of overdue invoices or customer‑level payment behavior.

SOLUTION

A Receivables & Billing Performance Dashboard in Power BI that tracks invoices end‑to‑end, from issue date to payment, enabling Finance and leadership to act quickly.

A prominent FMCG distributor in the Middle East faced a major challenge in tracking sales and inventory across multiple channels. We developed a Power BI dashboard to unify scattered data, surface key sales KPIs, and provide a clear view of primary and secondary sales performance.

PROBLEM

The client was managing sales and refund data from different silos, with limited visibility into inventory and heavy dependence on manual Excel reporting.

SOLUTION

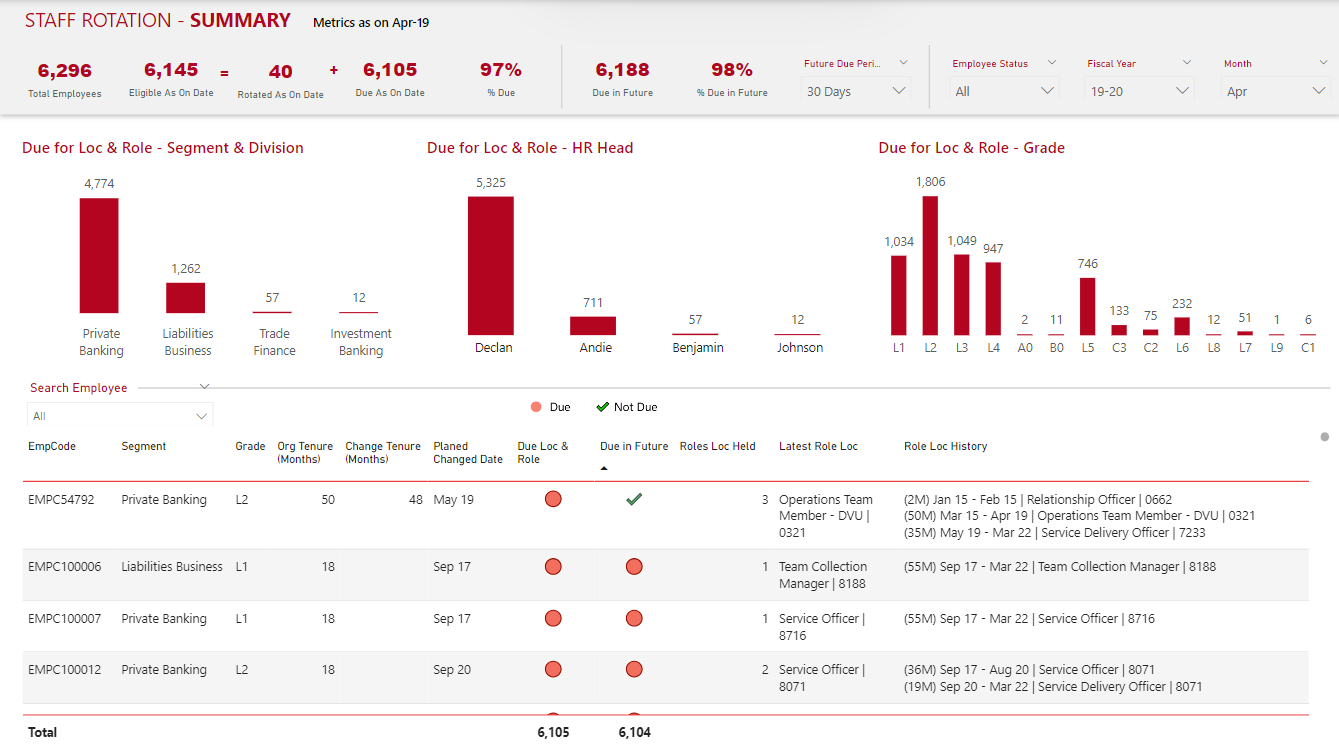
A Sales Performance Power BI dashboard that unifies sales data and provides a complete view of trends, categories, customers, and salespeople.

One of India’s leading financial institutions faced a major challenge in planning employee movements across the organisation as per RBI guidelines. We developed a Power BI dashboard to automate employee data mapping, identify key rotation metrics, and provide a clear view of due and upcoming employee movements.

PROBLEM

The client was handling employee rotation planning manually, with ad-hoc analysis and no clear system to track due employees or future movement requirements.

SOLUTION

An Employee Rotation Power BI dashboard that unifies employee movement data and provides a complete view of rotation status, due dates, and role-location analysis.

Ready to achieve similar results?

If your critical business reporting is held back by manual data wrangling, we can help build you automated reporting solutions.